Hyperscale Operator Capex Takes a Breather in Q1 – Down 2% from 2018
RENO, NV, May 29, 2019
New data from Synergy Research Group shows that hyperscale operator capex in the first quarter totaled just over $26 billion, dipping a little compared with the record-setting levels seen throughout 2018. Last year’s first quarter number was boosted by Google's $2.4 billion purchase of Manhattan real estate. Excluding that exceptional item, the Q1 capex came in 2% down from the first quarter of 2018. In terms of hyperscale companies the numbers broke even, with ten companies seeing year-on-year growth and ten showing a decline. In aggregate, capex for the last four quarters totaled $116 billion, 22% up from the preceding four quarters. The top five hyperscale spenders in Q1 were Amazon, Google, Facebook, Microsoft and Apple.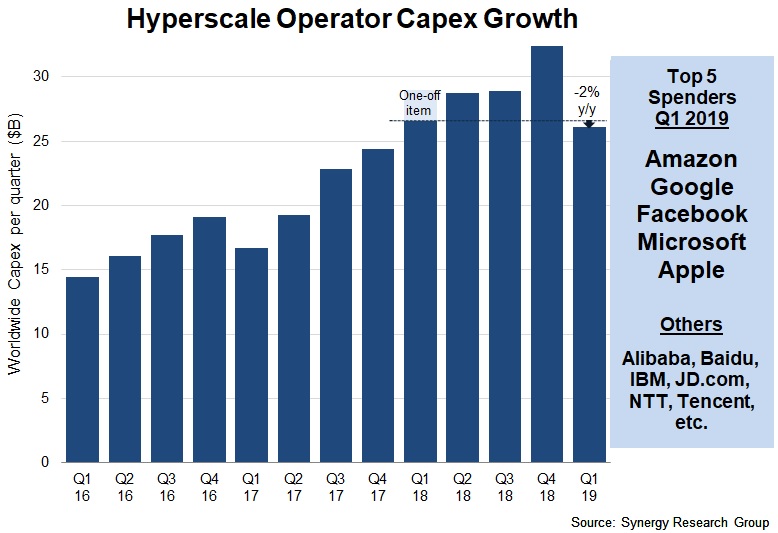 The hyperscale data is based on analysis of the capex and data center footprint of 20 of the world’s major cloud and internet service firms, including the largest operators in IaaS, PaaS, SaaS, search, social networking and e-commerce. Outside of the top five, other leading hyperscale spenders include Alibaba, Tencent, IBM, JD.com and Baidu. Much of the hyperscale capex goes towards building, expanding and equipping huge data centers, which have now grown in number to 458.
“After racing to new capex highs in 2018 the hyperscale operators did take a little breather in the first quarter,” said John Dinsdale, a Chief Analyst at Synergy Research Group. “However, though Q1 capex was down a little from 2018, to put it into context it was still up 56% from Q1 of 2017 and up 81% from 2016; and nine of the twenty hyperscale operators did grow their Q1 capex by double-digit growth rates year on year. We do expect to see overall capex levels bounce back over the remainder of 2019. This remains a game of massive scale with enormous barriers for those companies wishing to meaningfully compete with the hyperscale firms.”
About Synergy Research Group
Synergy Research Group delivers quarterly analyses of global IT and Cloud markets, offering detailed breakouts of vendor revenues and shipments by segment and region. Market shares and forecasts are provided through Synergy Interactive Analysis (SIA™) — the industry's only fully proprietary SaaS platform purpose-built for market share and forecasting analytics.
For more than 25 years, Synergy has been a trusted source of quantitative research and market intelligence across emerging communications and technology sectors. By combining syndicated research with specialized consulting, we deliver actionable intelligence to marketing and strategy executives worldwide.
Subscriptions: sales@srgresearch.com
Press inquiries: hgallo@srgresearch.com
A trusted source of accurate market data, Synergy is cited by industry leaders as well as leading financial, business, and trade publications such as The Economist, The New York Times, The Wall Street Journal, United States Federal Reserve Board, NPR, Forbes, Bloomberg, Financial Times, Bank of England, Fortune, and The Guardian.