Hyperscale Operator Capex Returns to Growth Mode in Q3
RENO, NV, December 3, 2019
New data from Synergy Research Group’s Hyperscale Market Tracker research service shows that hyperscale operator capex in the third quarter topped the $31 billion mark, up 8% compared with Q3 last year. Capex in the first two quarters of 2019 was down marginally compared to last year, so Q3 represents a significant return to growth. For the first three quarters in aggregate, capex is now ahead of the record-setting levels seen in 2018. The top five hyperscale spenders in Q3 were Amazon, Google, Microsoft, Facebook and Apple, whose capex budgets far exceed the other hyperscale operators. Four of them saw a big year-on-year increase in capex spending in Q3, with Apple being the exception.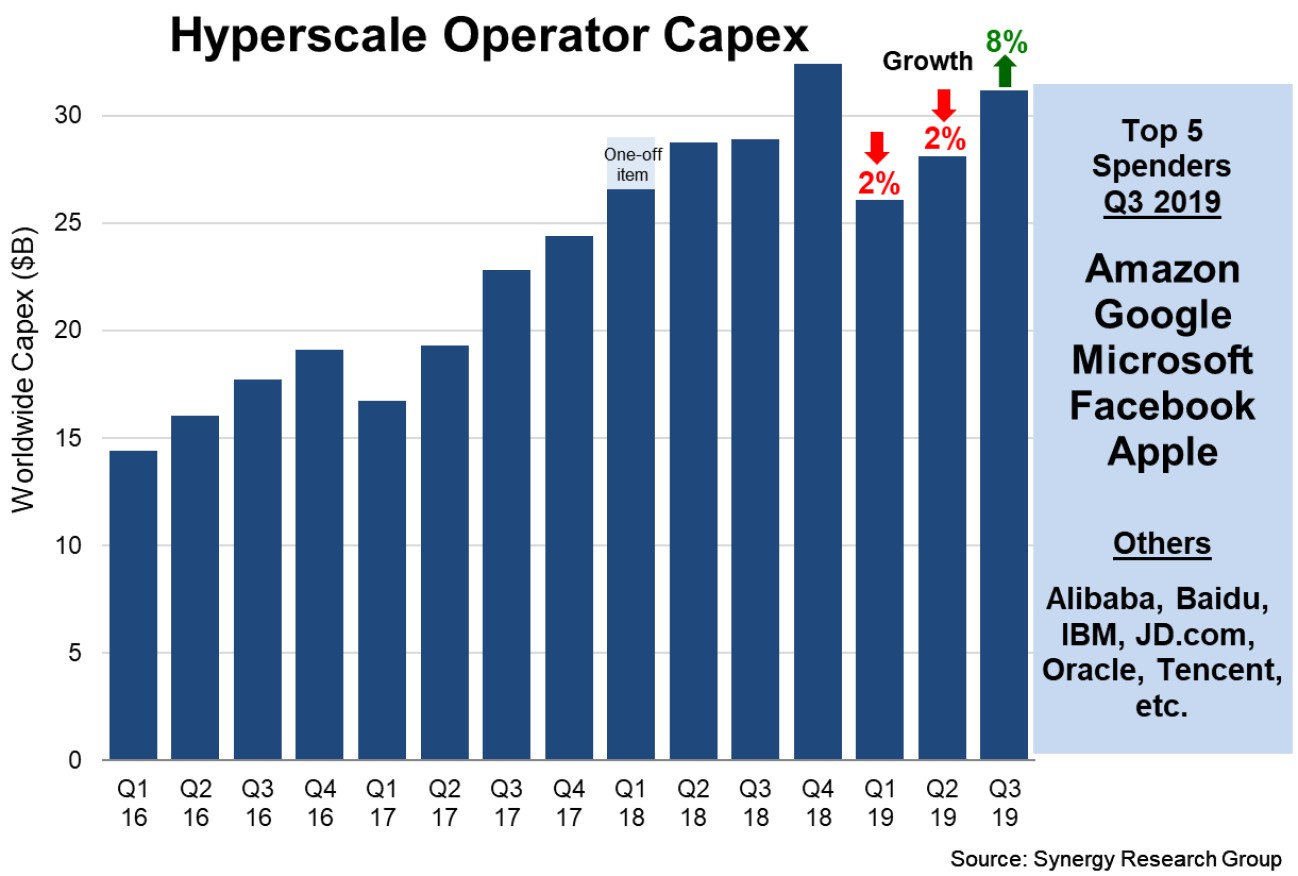 Much of the hyperscale capex goes towards building, expanding and equipping huge data centers, which have now grown in number to 504. The hyperscale data is based on analysis of the capex and data center footprint of 20 of the world’s major cloud and internet service firms, including the largest operators in IaaS, PaaS, SaaS, search, social networking and e-commerce. Outside of the top five, other leading hyperscale spenders include Alibaba, Tencent, IBM, JD.com, Baidu and Oracle.
“As expected there was a significant boost in capex in the third quarter, after a couple of quarters that were relatively soft in comparison with the lofty heights achieved in 2018,” said John Dinsdale, a Chief Analyst at Synergy Research Group. “Hyperscale companies are in growth mode and revenue growth rates remain in strong double-digit territory, with aggregated Q3 revenues up 14% over 2018. Amazon, Google, Facebook and Alibaba are all growing much more rapidly than that. These expanding companies are highly reliant on bigger and better data center operations, which will drive continued growth in capex levels.”
About Synergy Research Group
Synergy Research Group delivers quarterly analyses of global IT and Cloud markets, offering detailed breakouts of vendor revenues and shipments by segment and region. Market shares and forecasts are provided through Synergy Interactive Analysis (SIA™) — the industry's only fully proprietary SaaS platform purpose-built for market share and forecasting analytics.
For more than 25 years, Synergy has been a trusted source of quantitative research and market intelligence across emerging communications and technology sectors. By combining syndicated research with specialized consulting, we deliver actionable intelligence to marketing and strategy executives worldwide.
Subscriptions: sales@srgresearch.com
Press inquiries: hgallo@srgresearch.com
A trusted source of accurate market data, Synergy is cited by industry leaders as well as leading financial, business, and trade publications such as The Economist, The New York Times, The Wall Street Journal, United States Federal Reserve Board, NPR, Forbes, Bloomberg, Financial Times, Bank of England, Fortune, and The Guardian.