Hyperscale Operator Capex Jumps 43% in 2018 while Telco Spending Remains Flat
RENO, NV, March 7, 2019
New data from Synergy Research Group shows that hyperscale operator capex reached over $32 billion in Q4, far surpassing each of the first three quarters of the year, which had themselves set records. Full-year hyperscale capex jumped 43% to almost $120 billion. Meanwhile telco capex was over double that of hyperscale operators, but notably telco spending remained at the same level as the previous two years. The top five hyperscale spenders in 2018 were Google, Amazon, Microsoft, Facebook and Apple. Coincidentally their aggregate 2018 capex was almost identical to the capex of the top five telco spenders – China Mobile, AT&T, Verizon, NTT and Deutsche Telekom.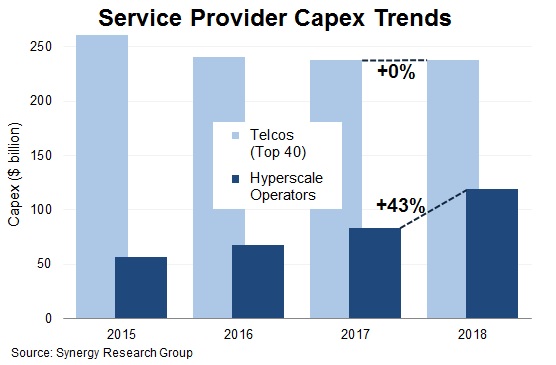 The hyperscale data is based on analysis of the capex and data center footprint of 20 of the world’s major cloud and internet service firms, including the largest operators in IaaS, PaaS, SaaS, search, social networking and e-commerce. Outside of the top five, other leading hyperscale spenders in 2018 included Alibaba, Tencent, IBM, JD.com and Baidu. Much of the hyperscale capex goes towards building, expanding and equipping huge data centers, which have now grown in number to 439. The telco data is based on tracking and analysis of the world’s 40 largest telcos, which in aggregate account for 85% of the communications services market.
“The hyperscale operators are quickly becoming the capex kings of the IT world,” said John Dinsdale, a Chief Analyst at Synergy Research Group. “On average hyperscale operator revenues are growing by 20% per year driven by expansion of cloud services, e-commerce, social media and online advertising; and it is notable that the leading players are investing an ever-increasing share of their revenues into capex. This is in stark contrast to telcos who are seeing neither revenues nor capex growing. We do not see these trends changing any time soon.”
About Synergy Research Group
Synergy Research Group delivers quarterly analyses of global IT and Cloud markets, offering detailed breakouts of vendor revenues and shipments by segment and region. Market shares and forecasts are provided through Synergy Interactive Analysis (SIA™) — the industry's only fully proprietary SaaS platform purpose-built for market share and forecasting analytics.
For more than 25 years, Synergy has been a trusted source of quantitative research and market intelligence across emerging communications and technology sectors. By combining syndicated research with specialized consulting, we deliver actionable intelligence to marketing and strategy executives worldwide.
Subscriptions: sales@srgresearch.com
Press inquiries: hgallo@srgresearch.com
A trusted source of accurate market data, Synergy is cited by industry leaders as well as leading financial, business, and trade publications such as The Economist, The New York Times, The Wall Street Journal, United States Federal Reserve Board, NPR, Forbes, Bloomberg, Financial Times, Bank of England, Fortune, and The Guardian.