Hyperscale Capex Leapt to a New High in Q1
RENO, NV, May 22, 2018
New Q1 data from Synergy Research Group shows that the capex of hyperscale operators jumped to $27 billion in the quarter, far surpassing all previous spending levels. Capex usually falls off in Q1 after a seasonal high in Q4, but this time sequential growth was well over 20% resulting in capex that was 80% higher than the first quarter in 2017. Even allowing for a large one-off item at Google, this would still have easily been a record-breaking quarter. While the relative ranking moves around each quarter, the top five group of spenders always consists of Google, Microsoft, Amazon, Apple and Facebook, which in aggregate account for over 70% of hyperscale capex. It is particularly notable that capex levels at four of the big five were at an all-time high in Q1.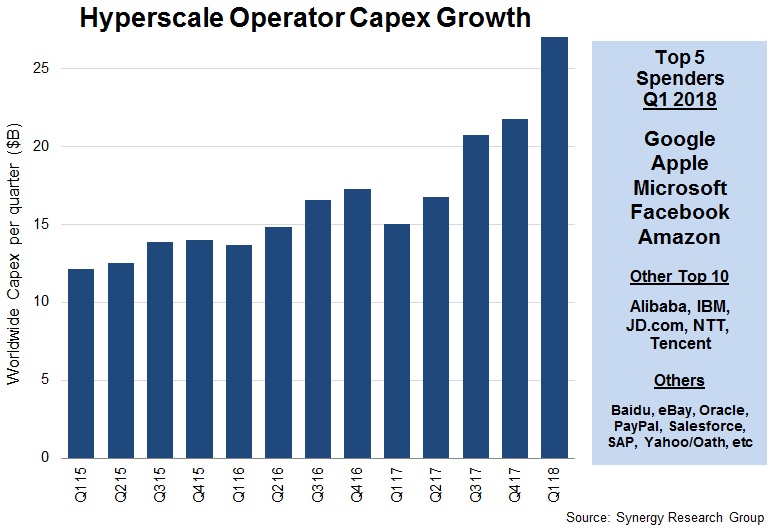 The $27 billion spending figure in Q1 compares to total hyperscale capex in 2017 of $74 billion. Much of that hyperscale capex goes towards building and expanding huge data centers, which have now grown in number to over 420. The research is based on analysis of the capex and data center footprint of 24 of the world’s major cloud and internet service firms, including the largest operators in IaaS, PaaS, SaaS, search, social networking and e-commerce. Outside of the top five, other leading hyperscale spenders in Q1 were Alibaba, IBM, JD.com, NTT and Tencent. Other notables outside of the top ten include Baidu, eBay, Oracle, PayPal, Salesforce, SAP, Yahoo Japan and Yahoo/Oath.
“2017 was a standout year for hyperscale capex, but 2018 has started out with some staggering numbers,” said John Dinsdale, a Chief Analyst and Research Director at Synergy Research Group. “Our detailed quarterly market tracking has consistently shown strong growth in cloud services, SaaS, hyperscale data center footprint and spending on public cloud data center hardware, but even so these capex numbers took us by surprise. We have long said that this is a game of scale in which most service providers cannot hope to compete; here is some of the clearest evidence yet.”
About Synergy Research Group
Synergy Research Group delivers quarterly analyses of global IT and Cloud markets, offering detailed breakouts of vendor revenues and shipments by segment and region. Market shares and forecasts are provided through Synergy Interactive Analysis (SIA™) — the industry's only fully proprietary SaaS platform purpose-built for market share and forecasting analytics.
For more than 25 years, Synergy has been a trusted source of quantitative research and market intelligence across emerging communications and technology sectors. By combining syndicated research with specialized consulting, we deliver actionable intelligence to marketing and strategy executives worldwide.
Subscriptions: sales@srgresearch.com
Press inquiries: hgallo@srgresearch.com
A trusted source of accurate market data, Synergy is cited by industry leaders as well as leading financial, business, and trade publications such as The Economist, The New York Times, The Wall Street Journal, United States Federal Reserve Board, NPR, Forbes, Bloomberg, Financial Times, Bank of England, Fortune, and The Guardian.