Hyperscale Capex Jumped 59% in the Second Quarter, Maintaining Record Start to Year
RENO, NV, August 27, 2018
New Q2 data from Synergy Research Group shows that the capex of hyperscale operators was up 59% from a year ago, maintaining a record-setting start to the year. Capex in the first half topped $53 billion, compared with $31 billion in the first half of 2017. Q2 capex would have been comfortably the highest ever had it not been for Google's purchase of Manhattan’s Chelsea Market building in March, which gave the Q1 numbers a $2.4 billion boost. While the relative ranking moves around each quarter, for the last ten quarters the top five group of spenders has always consisted of Google, Microsoft, Amazon, Apple and Facebook, which in aggregate account for well over 70% of hyperscale capex. It is notable that capex levels at three of the big five were at an all-time high in Q2.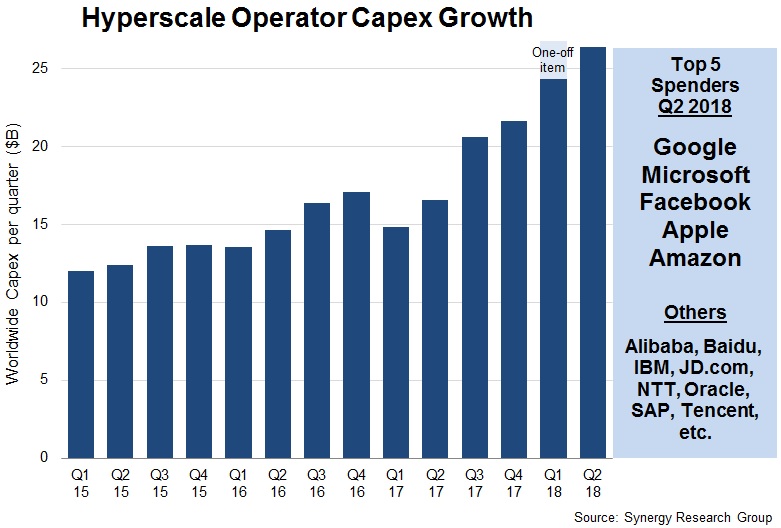 Much of the hyperscale capex goes towards building and expanding huge data centers, which have now grown in number to 420. The research is based on analysis of the capex and data center footprint of 20 of the world’s major cloud and internet service firms, including the largest operators in IaaS, PaaS, SaaS, search, social networking and e-commerce. Outside of the top five, other leading hyperscale spenders in Q2 included Alibaba, Baidu, IBM, JD.com, NTT, Oracle, SAP and Tencent.
“Hyperscale capex is one of the clearest indicators of the growth in cloud computing, digital enterprise and online lifestyles,” said John Dinsdale, a Chief Analyst at Synergy Research Group. “Capex has reached levels that were previously unthinkable for these massive data center operators and it continues to climb. The largest of these hyperscale operators are building economic moats that smaller competitors have no chance of replicating. In cloud computing especially, the ability to fund hyperscale capex levels has become a competition killer.”
About Synergy Research Group
Synergy Research Group delivers quarterly analyses of global IT and Cloud markets, offering detailed breakouts of vendor revenues and shipments by segment and region. Market shares and forecasts are provided through Synergy Interactive Analysis (SIA™) — the industry's only fully proprietary SaaS platform purpose-built for market share and forecasting analytics.
For more than 25 years, Synergy has been a trusted source of quantitative research and market intelligence across emerging communications and technology sectors. By combining syndicated research with specialized consulting, we deliver actionable intelligence to marketing and strategy executives worldwide.
Subscriptions: sales@srgresearch.com
Press inquiries: hgallo@srgresearch.com
A trusted source of accurate market data, Synergy is cited by industry leaders as well as leading financial, business, and trade publications such as The Economist, The New York Times, The Wall Street Journal, United States Federal Reserve Board, NPR, Forbes, Bloomberg, Financial Times, Bank of England, Fortune, and The Guardian.